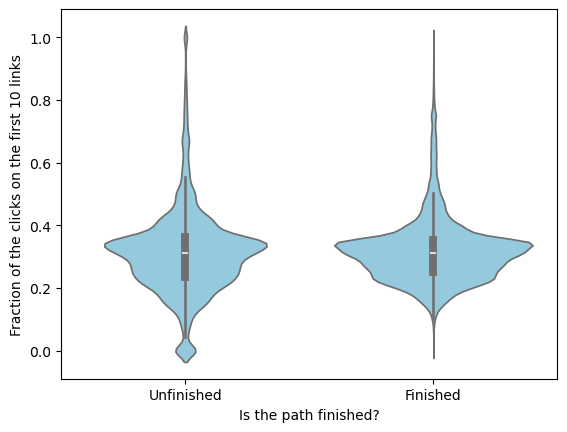
It looks like players that manage to complete their game tend to play differently than players who don’t. Let’s analyze this before we show our amazing model to simulate players! It might be that players who complete the game tend to click on higher placed links? The following plot shows the distribution of the percentage of clicks on the first 10 links for both the finished and unfinished paths.
Since it is hard to quantify speed for players that did not manage to complete the game they played, let us focus on finished paths. We will make a finer analysis by quantifying efficiency of players. We will define the efficiency of a finished path \(P\) taken by a player as follows:
\[\operatorname{Efficiency}(P) = \frac{\operatorname{length}(P)}{\text{Length of the shortest possible path between the same start and end points}}\]So an efficiency of \(1\) would mean that the player played perfectly. We can now compare the efficiencies with the lengths of finished paths. In fact, the efficiency is highly correlated with the length of the path:
Here we removed all paths of length greater than 23, which corresponds to removing roughly the top 1% of longest paths. We also multiplied by 10 the width of the confidence interval for visibility. The value of the coefficient \(R^2\) is 0.76 and the Pearson correlation between the two variables is 0.873. The analysis reveals a highly statistically significant linear relationship between path length and efficiency (p < 0.001).
So we need to be careful since the efficiency is highly correlated with the length of a path, which makes sense because there are always very short path possible that are very hard to find for a human. But what can be said about the relation of the efficiency and the duration of the game? By duration of the game we mean the time that the player spent playing. Here we report the link between the duration and the efficiency, where we normalized by rows.
We will now try to answer the following question:
Are more efficient players also more consistent in their choices?
By more consistent here, we mean that they click on links whose positions are less variables (relatively to their positions on the article). We now compare efficiency with the consistency of players. We will divide the paths in 3 categories: optimal (efficiency \(=\) 1), Good (1 \(<\) efficiency \(\leq\) 2 ) and Poor (efficiency \(>\) 2). This plot shows the distribution of the standard deviation of link positions within each player’s path, grouped by efficiency level. Here, a standard deviation of zero means that the player always clicked on links with the same relative position within the article, while a higher standard deviation indicates that the player clicked on links with more varied relative positions.
The computed Pearson correlation coefficients are:
- Efficiency vs. Position Standard Deviation: r = 0.101 with p-value \(<\) 0.001
- Path Length vs. Position Standard Deviation: r = 0.175 with p-value \(<\) 0.001
Overall, our analysis suggests that efficiency alone is not a strong indicator of fundamentally different navigation patterns. While efficient players tend to complete shorter paths and appear more consistent in their link choices, these effects are largely explained by path length itself rather than efficiency. Now iff we hold path length fixed, do more efficient players behave more consistently?
However, there is a positive correlation between the shortest possible path and the average relative position of the path taken by the player.
As the length of the optimal path increases, the average link position tends to be further in the article. Here the Pearson correlation coefficient is \(r=0.110\) with a p-value less than 0.001.
Hint
- We wanted to analyze playing on subgraphs, for that we had to come up with a solution.
Take a deep breath ! This is the second break in our data story ! We studied the general behavior of players, and specific behaviors. They have no reason to have disappeared between 2007 and today, we can surely conclude that players still obey the same rules as before. After all, Gen Z cannot be that different…