Careful! Lazy does not mean slow!
We have seen that even if we have a couple of top links at our disposal, we can finish a lot of paths and pretty quickly.
Firstly, Wikispeedia is a game where beeing fast is important, in that sense it makes sense to be lazy and not bother scrolling down. Most links will be repeated anyway.
Secondly, if you have a huge set (with repetition) of links to choose from, it will be much harder to decide on which link to click on and you will thus be slower… Imagine having to choose between all 458 links of the United States page.
Let’s see if players actually tend to click only on the first articles.
The next plot shows the (smoothed) amount of clicks on each article compared to the relative position throughout the article. In red the density of the actual number of articles is shown. Here we restricted to the first appearence of each link, which means that if a link appeared twice on the same article we only considered the first one because the format of the data does not allow us to see which link is being clicked. This choice is reasonable because players start at te beginning of the article and scroll down so there is a higher probability they click on the top one (they might never see the bottom ones).
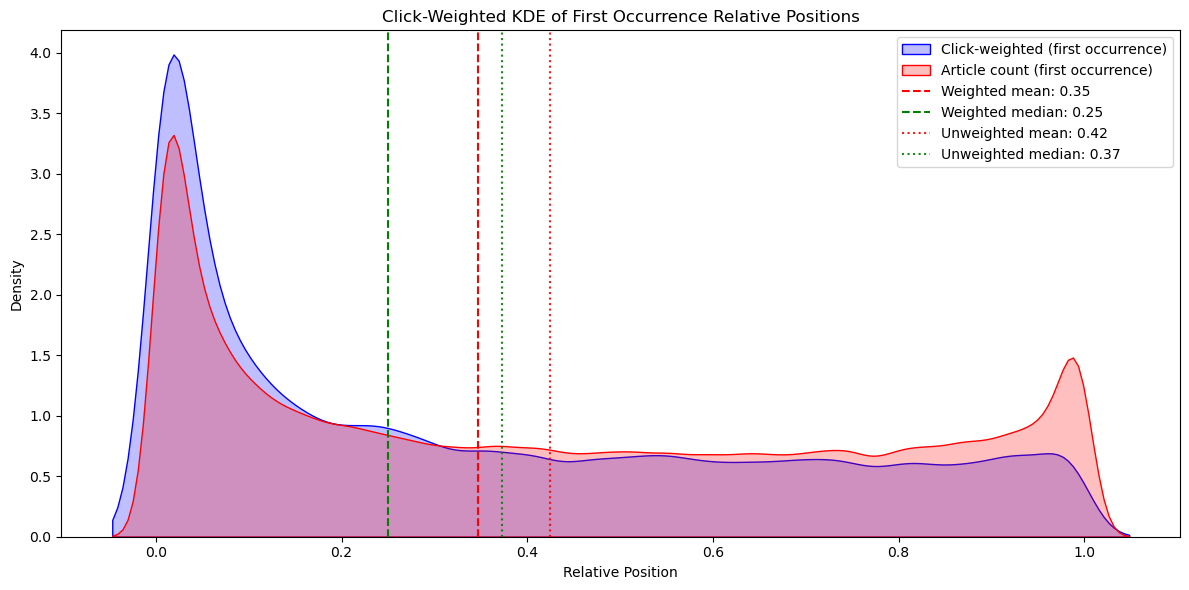
This highlights that players like to click on the top of pages, but how many of them stick to them the whole game?
To answer this question, let us use a similar plot as in the previous section and see how many players paths only used the first n links for each page they went through.
This plot shows the number of paths taken by players that only follow the first n hyperlinks, with n represented on the x-axis.
As we can see, the number of paths using only the first n hyperlinks grows really fast for the first values of n. The proportion of each length also seems to be stable for each choice of n.
However, we still did not investigate the amount of unfinished path in the above plot. The following plot shows the same distribution but distinguishes between finished and unfinished paths taken by players.
Let us have a more precise look at the distributions of the lengths and compare slow and fast players. The next table provides a summary of path lengths split by completion status.
| Length | Finished | Unfinished |
|---|---|---|
| 1 | 11 | 5214 |
| 2 | 798 | 3223 |
| 3 | 3424 | 3165 |
| 4 | 8558 | 2727 |
| 5 | 10941 | 2457 |
| 6 | 8137 | 1784 |
| 7 | 5868 | 1437 |
| 8 | 3954 | 961 |
| 9 | 2650 | 798 |
| ≥10 | 6977 | 3109 |
Hint
- We want to look at good players